Rocket Pro UI/UX Revamp
TEAM


MY ROLE
• Led the end-to-end design strategy for Rocket Pro, establishing myself in the design team.
• Had full creative freedom to experiment with new UX approaches and shape the product vision.
• Successfully aligned stakeholders and rallied fellow designers around a shared mission.
• Drove the product from concept to completion, ensuring business goals and user needs were met.
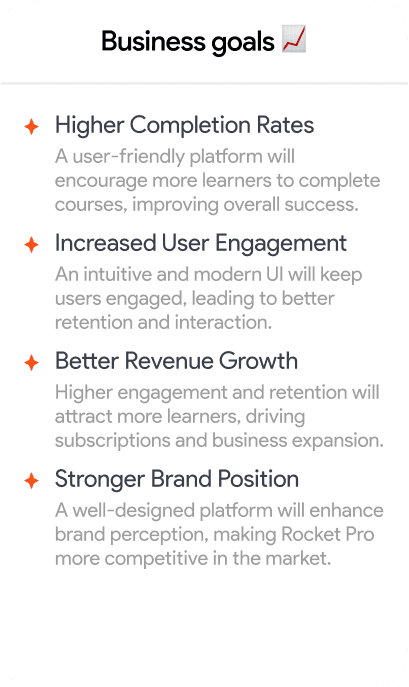
A new Rocket Pro experience that enhances user engagement and boosts course completion rates through an intuitive UI/UX.
TIMELINE FOR DESIGN
3 months
OUTCOME
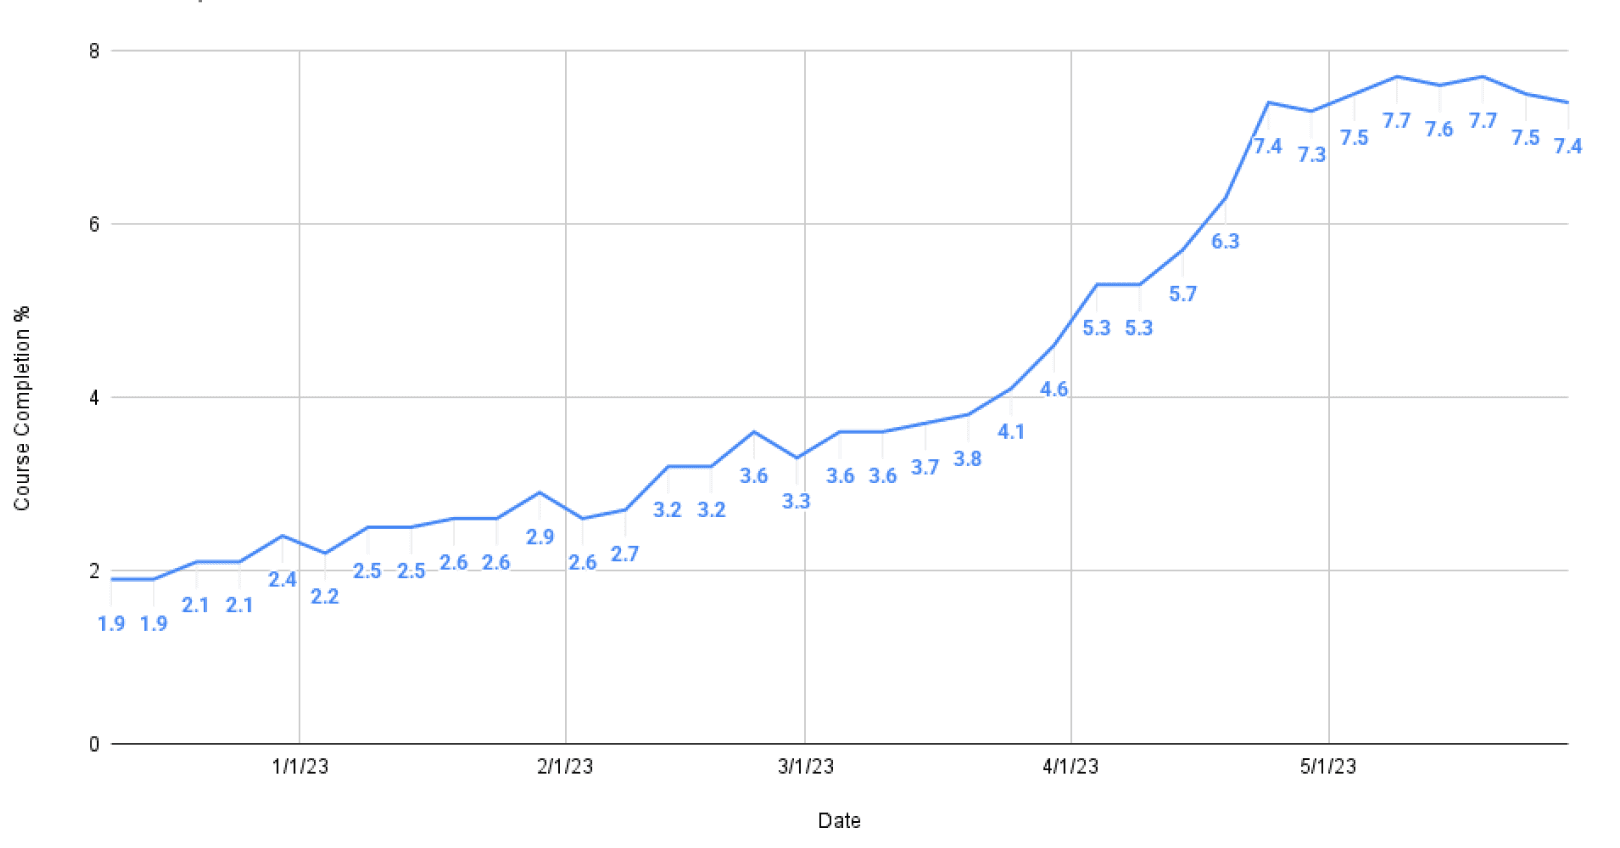
High course completion
Course completion grew from 1.9% to & 7%
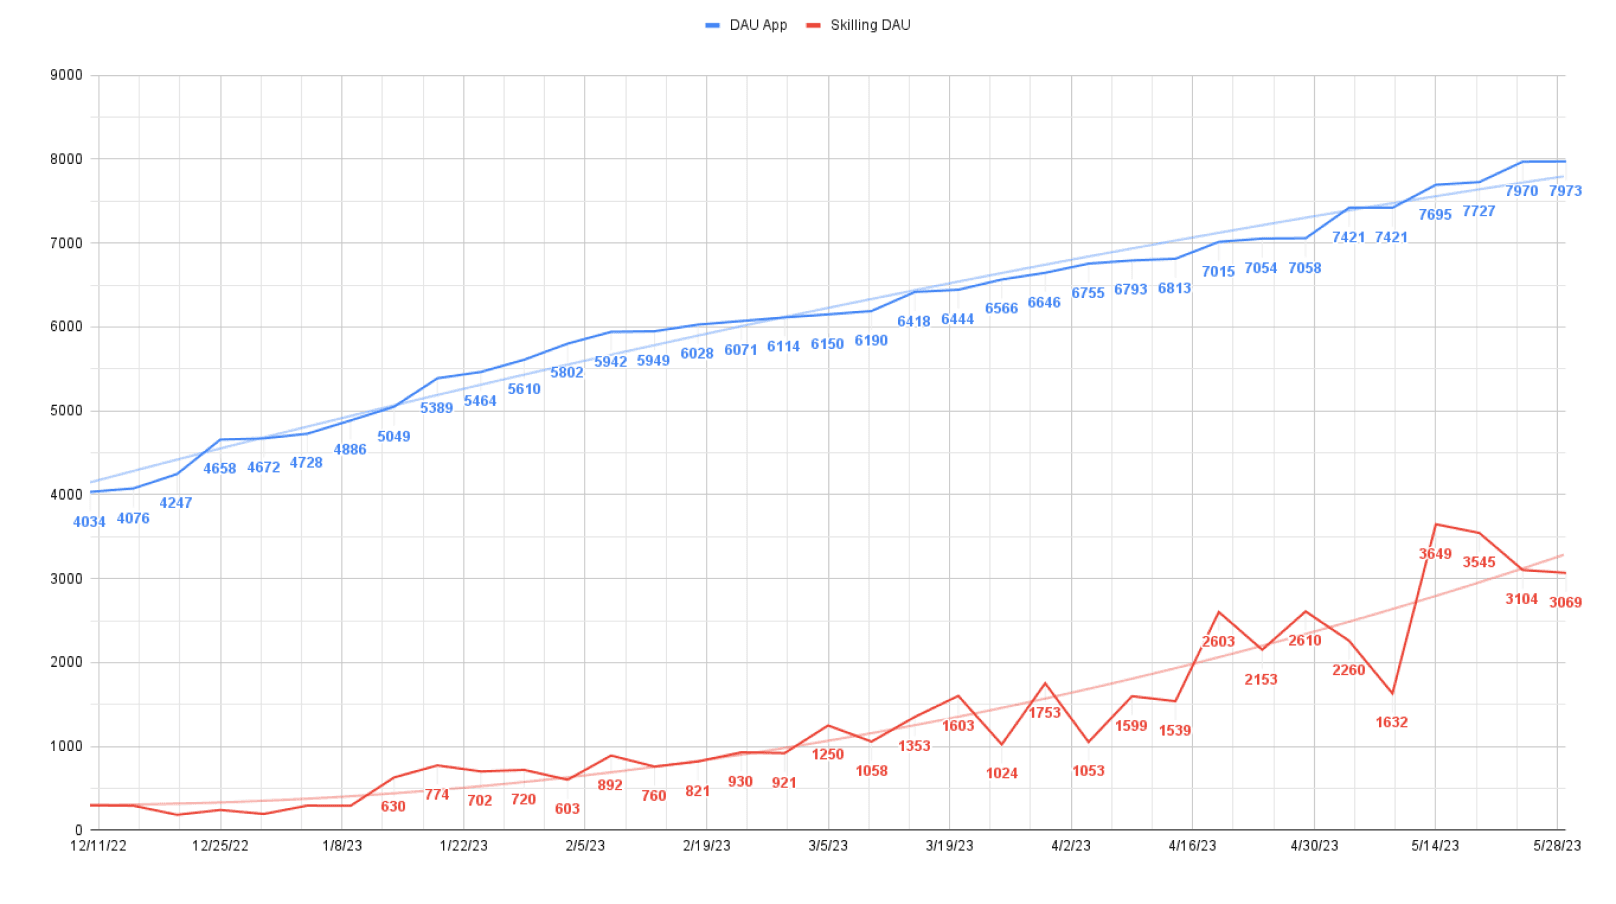
Increase in DAU
DAU increased from 9-10% to up to 38% on average.
B2C

9:41
Context
Who is betterplace:
BetterPlace is Asia’s leading human capital SaaS platform, empowering enterprises to manage the complete lifecycle of their frontline workforce. As an HRMS solution, BetterPlace addresses every aspect of frontline workforce management, including discovery, hiring, onboarding, background verification, payroll, upskilling, and services such as vendor management, workforce fulfillment, insurance, and credit. Our solutions are used by over 1,500 businesses across 500 locations in the APAC, India, and GCC regions.
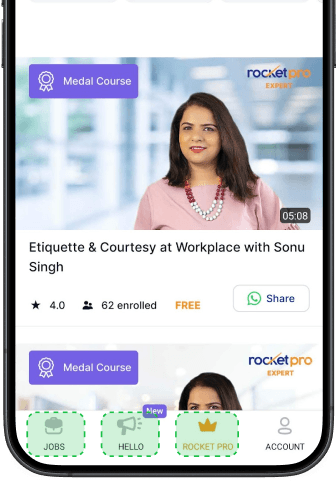
What is Rocket pro?
Add on to the SaaS platform, in May 2022, Betterplace acquired two platforms: Aasan Jobs (a job-seeking platform) and Oust (a learning platform for corporate employees).
With these acquisitions, Betterplace created Rocket Pro, a learning platform specifically for blue-collar workers in India. Rocket Pro aimed to teach essential skills like Excel, English, and stress management.
What’s the problem
Research with users
Despite its potential, Rocket Pro had a very low course completion rate (less than 2%).
The general hypothesis was that the outdated UI was the problem, as it hadn't been updated since 2015. To improve user engagement and completion rates, a UI/UX revamp was necessary.
Lets find the root
Validating hypothesis
Before directly revamping the UI, we took a holistic approach to identify the root issues and the best solutions. The approach we followed was:
sTEP 1
sTEP 2
sTEP 3
sTEP 4
sTEP 4
Target audience
User behaviour
Competitor research
content evluation
Visual design
Analysing the current user base to pinpoint key segments.
Observing how users interacted with the app and identified pain points.
Studing market trends and industry benchmarks.
Categorizing all existing components.
Using insights to build our own visuals
Our aPPROACH
STEP 1
Defining the Target Audience:
Our approach
How to choose them?
With 1 lakh monthly active users (MAU) on Rocket, we first analyzed the current user landscape—identifying who regularly engaged with the platform and how they used it. This helped us pinpoint the right users for in-depth interviews and further research.

Our approach
Target audience
Final Target Audience for Interviews:
Young professionals in Back Office, Delivery Boy and Customer Care roles
Graduates and 12th-pass users
A mix of male and female users (Male majorly)
Entry-level users with little to no work experience
Check out this excel sheet for more data
STEP 2
User behaviour analysis
Our approach
User interviews
Now that we have identified our user we wanted to conduct user interview to understand how they are interacting with our app
We curated the types of questions we needed to ask, and you can find them in this link.
Our approach
Research insights
The insights from these user interviews clearly showed how confusing and ineffective our product was, making it crucial to fix these issues. It reinforced the urgent need for a UI/UX revamp to improve both the user experience and business growth.
Some of the important insights are lllustrated belowFor detailed Interview insights, please check out this excel file
Navigation bar
Navigation bar


RocketPro vs Hello vs Jobs


UI/UX Feedback


Certificate vs Medal vs Guidance


So the problem is clear now,
Approach 1
Buisness problem:
Poor usability led to low engagement, high drop-off rates, and reduced user retention. Users struggled to navigate the platform and understand its value, making it harder to attract and retain learners. This negatively impacted revenue growth and brand perception, limiting Rocket Pro’s market potential.
Approach 1
User problem:
Rocket Pro’s confusing navigation and unclear labeling made it hard for users to find what they needed, leading to frustration and disengagement. Many struggled to understand key features, course types, and interactive elements, making learning feel complex rather than smooth. The lack of clarity and intuitive design reduced motivation, causing low course completion rates.


DEFINED PROBLEM TO SOLVE
Need a complete revamp of Rocket Pro’s UI/UX course page to simplify navigation, improve clarity, and create an intuitive learning experience.
This will help users easily find and complete courses, increasing engagement and completion rates while driving business growth by attracting more learners and boosting revenue.

STEP 3
Market Analysis & Benchmarking
Our approach
Objectives
Explore how apps with complex functionalities design their upskilling sections.
Identify common UX patterns and mental models familiar to our target audience.
Gather UX inspiration and explore innovative approaches for a sustainable and effective learning experience.
Our approach
Benchmarking Competitors:
We analyzed various companies across different domains, including:
Upskilling & Learning Platforms: Coursera, Udemy, Byju’s, Seekho, KIMO
Gamified Learning & Habit-Forming Apps: Duolingo, Habitica, Stepapp
AI & Coaching-Based Platforms: Woebot, Headway
Community-Driven Learning: Sheroes Community, Junoon
This research helped us understand industry best practices and uncover opportunities for improving our product’s learning experience.
Upskilling & learning
Gamified & Habit-Forming
AI & Coaching-Based
Community-Driven Learning


Our approach
Insights
From the competitor analysis, we gained several valuable insights and realized that our product fell short compared to market standards.
For a detailed view of our research and findings, check out this Figma file
For a detailed view of our research and findings, check out this Figma file (…).
Among all the findings, two stood out as the most crucial:
UI Quality – The competitors' UI quality inspired us and served as the foundation for our new design. (Details will discussed along with the solution in the Visual solution section)
User flow – We noticed 2-3 unnecessary static screens at crucial points, requiring extra user interactions. So, we removed them from the flow.
STEP 4
content analysis
Our approach
Objectives
Rocket had a strong base of daily active users. We analyzed their learning behavior, drop-offs, and content engagement to optimize completion rates.
Our approach
Key insights
Key Insights
Course Performance: Four content types: Image Card, SCORM, Video Landscape, and Video Portrait. Video Landscape had the highest completion rate.
Engagement Trends: Average course duration: 14 minutes; user engagement: 9 minutes.
Enrollment vs. Completion: Top 30 enrolled courses (Image Cards) had only 7% completion rate. Thumbnails drive enrollments, but engaging content boosts completions.
Assessment Analysis: Match the Following & Fill in the Text had high drop-offs. MCQs & True/False retained users better.
For detailed content analysis insights, please check out this excel file
Result
Content guidlines
After analyzing the problem, we established a content guideline for the engineering and content teams to follow. The defined guidelines are illustrated below:
Navigation bar

1

2
3

4
STEP 5
Visual Solution
Our approach
Path to bring solution
To make visualisation easier, we categorize the solution into 4 milestones:
MILESTONE 1
Course landing page

MILESTONE 2
Course chapters


MILESTONE 3
Assessment chapter
MILESTONE 4
Feedback and Animations

Milestone 1
Course landing page
M1.1
New course starters
Users who are beginning a new module. Each module contains multiple courses and assignments
after
before

M1.2
In-progress learners
Users who are in the middle of the course and have completed at least one lesson within the module.
after
before

M1.3
Course completers
Users who have completed all courses within the module.
after
before

M1.4
Full page design
after
before

Milestone 2
Course chapters
M2.1
Chapters
Each course consists of multiple chapters and assessments. And each chapter contains multiple lessons.
after
before

M2.2
Video player
after
before

Milestone 3
Assessments
M3.1
Questions
after
before

M3.2
Answer reviews
after
before

Milestone 4
Feedback and Animations
M4.1
Feedbacks
after
before

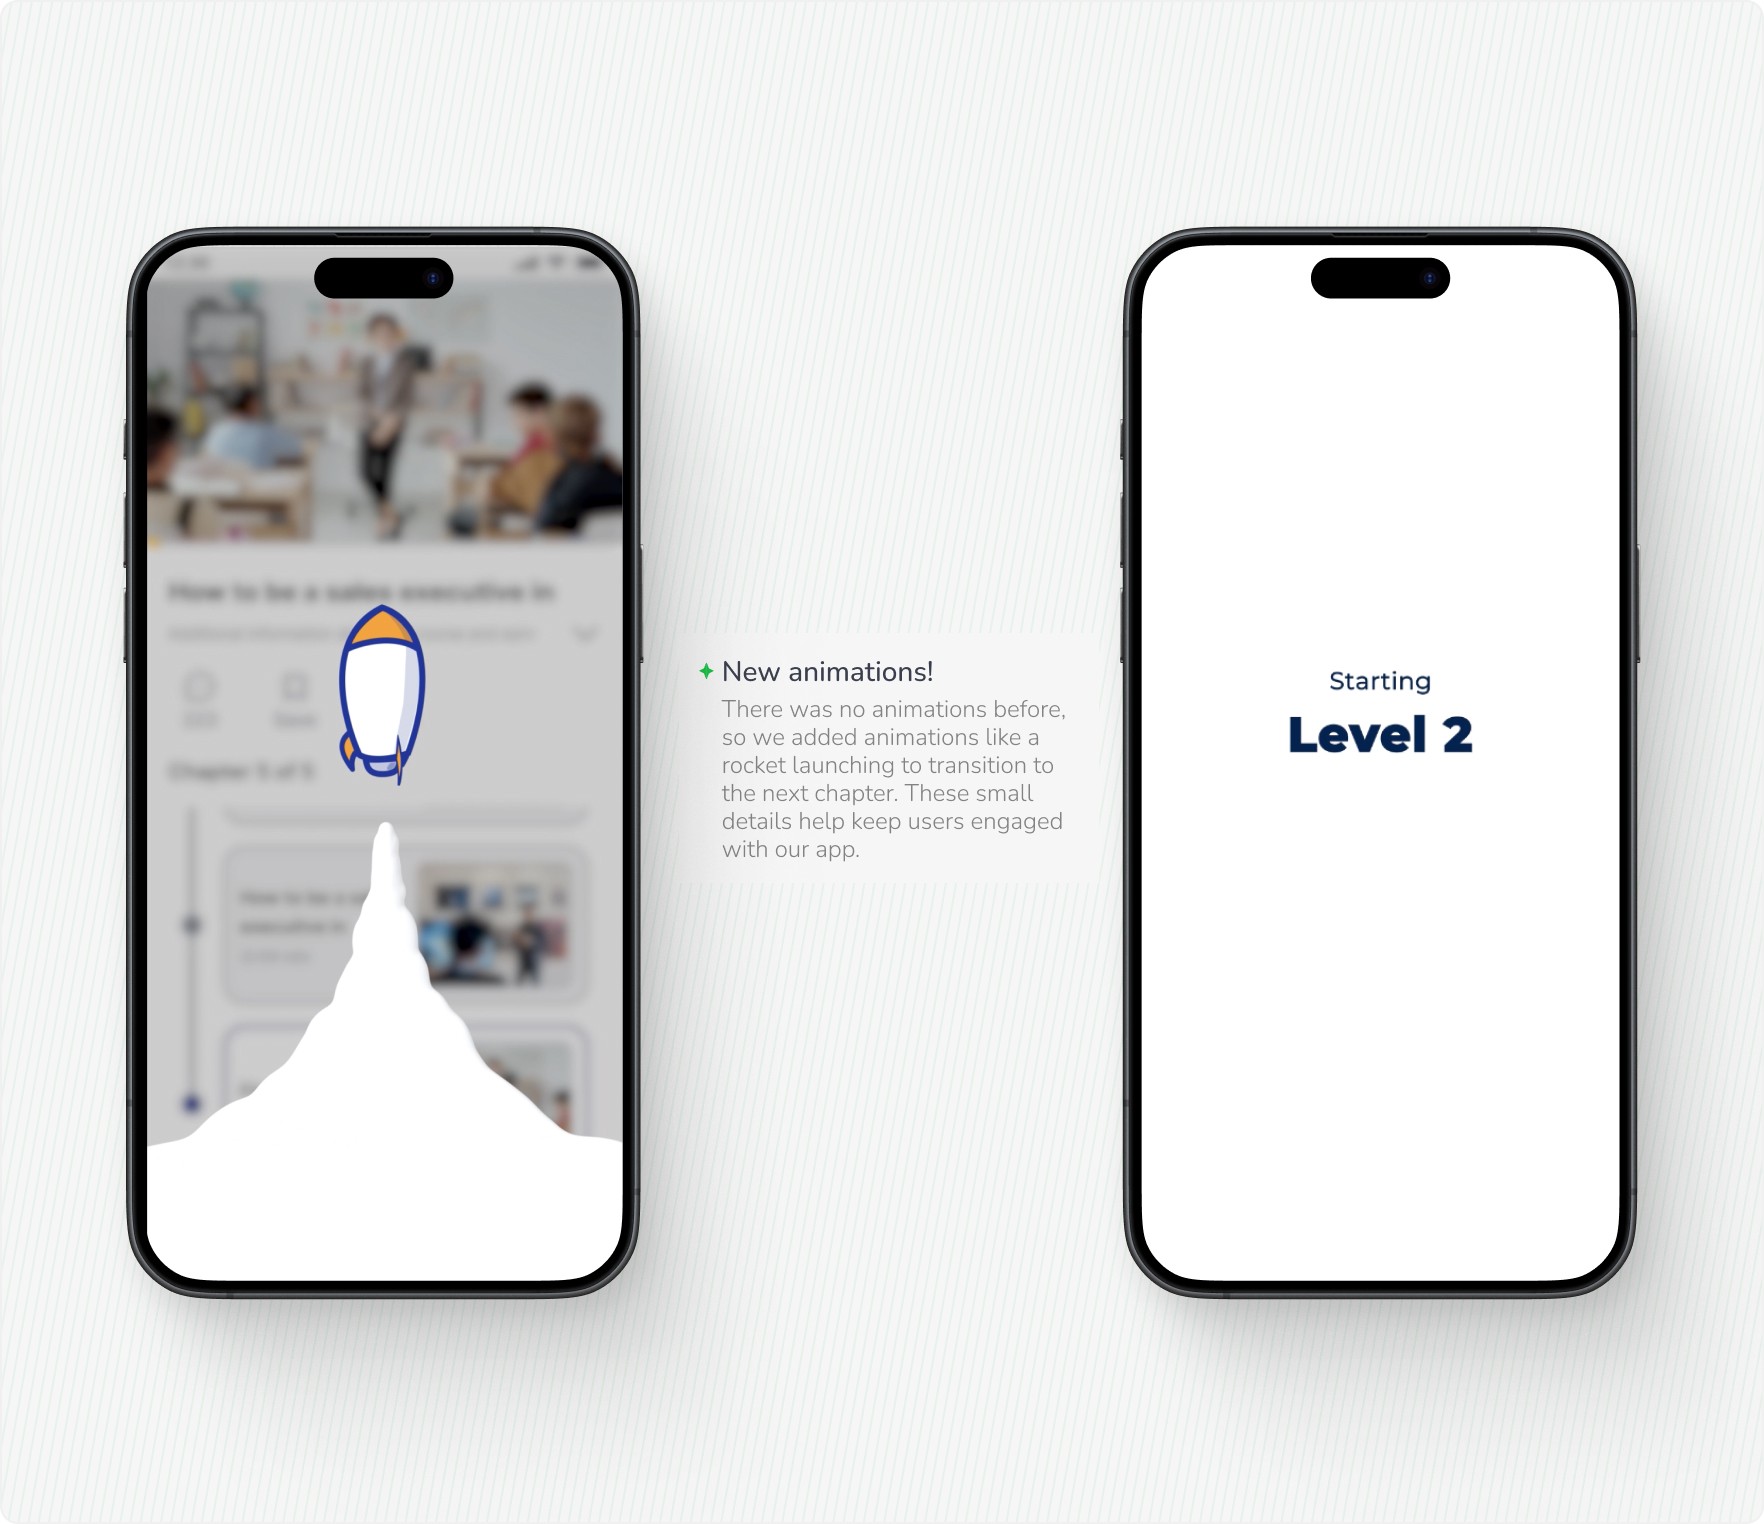
M4.2
Animations
Time to Flex Our Impact Muscles.
Our approach
Impacts
We achieved great results from this design revamp, with significant improvements in user engagement, session duration, and course completion rates.
Course completion grew from 1.9 to & 7%
DAU increased from 9-10% to up to 38% on average.
Session duration increased from 3.5 minutes to 14.9 minutes per session.
1.9
%
7
7
%
COURSE COMPLETION RATE

9
%
38
38
%
DAILY ACTIVE USERS

3.5
mins
mins
14
14
Session duration

What this project Taught Me?
Learnings
Research is Key
This project reinforced the importance of thorough research in identifying user pain points. Without it, we might have solved the wrong problems.
Keeping It Simple for Users
Blue-collar workers prefer easy-to-use apps. This taught me that the flow should be simple and not make users do extra work.
Learning from Big Platforms
Analyzing platforms with a large user base allowed us to validate our hypotheses faster and refine our approach effectively.
Other works